SQL, Databases & R
By Jamel Thomas
SQL is a querying language used to manipulate databases. On its own, it is a powerful tool in any Data Scientist’s toolbox. When you pair SQL with R (or Python), you have indespensible foundations to conduct even the basic analytics. This is not so much a lesson on SQL, but a lesson on connecting SQL with R via various packages. Moreover, we will use the packages dbplyr and dplyr to manipulate the datasets in a later blog.
Ready….. FIGHT!
Intro
When you are using small data, it is fairly easy to store it locally. However, this can get more and more cumbersome as your data grows. Using databases instead of storing all of your data on a flat file in memory is a lot more efficient because you can query only the data you need at any given time.
R has the ability to connect to almost any database type via pacakages. The widely used types can range from MySQL, PostgreSQL and vSQL. We will explore the schools database found on my website and github.
https://jamelt.com/data/CA_REMEDIAL_2014-2016.txt
library(sqldf)## Loading required package: gsubfn## Loading required package: proto## Loading required package: RSQLiteschool <- read.table(url, header = T)Let’s first take a look at the data:
head(school)## college ethnicity group
## 1 College of Alameda African American Four Levels Below Transfer
## 2 College of Alameda Asian Four Levels Below Transfer
## 3 College of Alameda Hispanic Four Levels Below Transfer
## 4 College of Alameda White Non-Hispanic Four Levels Below Transfer
## 5 Allan Hancock College African American Four Levels Below Transfer
## 6 Allan Hancock College Asian Four Levels Below Transfer
## students sum success subject
## 1 24 4 16.67 English
## 2 19 4 21.05 English
## 3 14 0 0.00 English
## 4 5 1 20.00 English
## 5 6 0 0.00 English
## 6 5 1 20.00 Englishstr(school)## 'data.frame': 4702 obs. of 7 variables:
## $ college : Factor w/ 114 levels "Allan Hancock College",..: 17 17 17 17 1 1 1 1 1 3 ...
## $ ethnicity: Factor w/ 8 levels "African American",..: 1 3 4 8 1 3 4 5 8 1 ...
## $ group : Factor w/ 4 levels "Four Levels Below Transfer",..: 1 1 1 1 1 1 1 1 1 1 ...
## $ students : int 24 19 14 5 6 5 86 2 8 3 ...
## $ sum : int 4 4 0 1 0 1 20 1 0 1 ...
## $ success : num 16.7 21.1 0 20 0 ...
## $ subject : Factor w/ 2 levels "English","Math": 1 1 1 1 1 1 1 1 1 1 ...Now to use SQL, we just add the string query in the sqldf() function
query <- "SELECT count(college) FROM school WHERE ethnicity = 'African American' GROUP BY subject"
sqldf(
  query
)
## count(college)
## 1 281
## 2 388The GROUP BY here is an aggregator that will summarize the data by a selected factor of two or more levels.
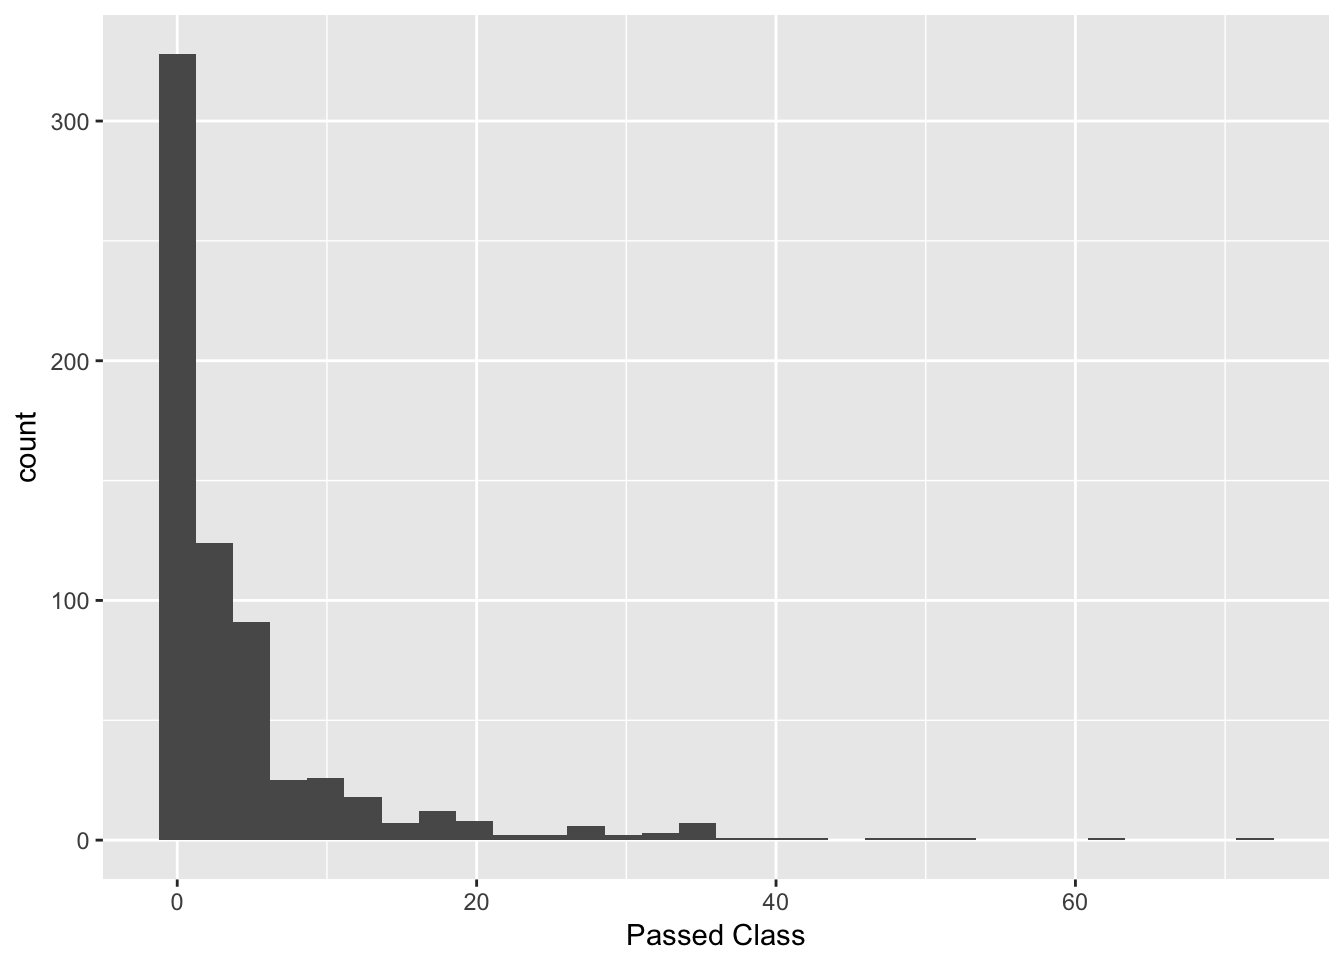
library(ggplot2)
DF = sqldf(
  "SELECT * FROM school WHERE ethnicity = 'African American' "
)
qplot(DF$sum, data = DF, geom = 'histogram') + xlab("Passed Class")
## `stat_bin()` using `bins = 30`. Pick better value with `binwidth`.