Flexdashboards
By Jamel Thomas
Everyone knows high-level languages are wonderful. The issues of yester-year are long gone; we no longer have to build dashboards from scratch. Being able to query data, and display directly through R is here, and I don’t see it going anywhere anytime soon.
Flexdashboard is an open source package in R that allows users to display dashboards directly in browser. It also has publishing support through RStudio. Assuming you have moderate traffic (like me), it’s perfect!
You can take a look at the dashboard I build here: https://jamelt.com/flex-dashboard-example
Let’s get started:
#install.packages("flexdashboard")
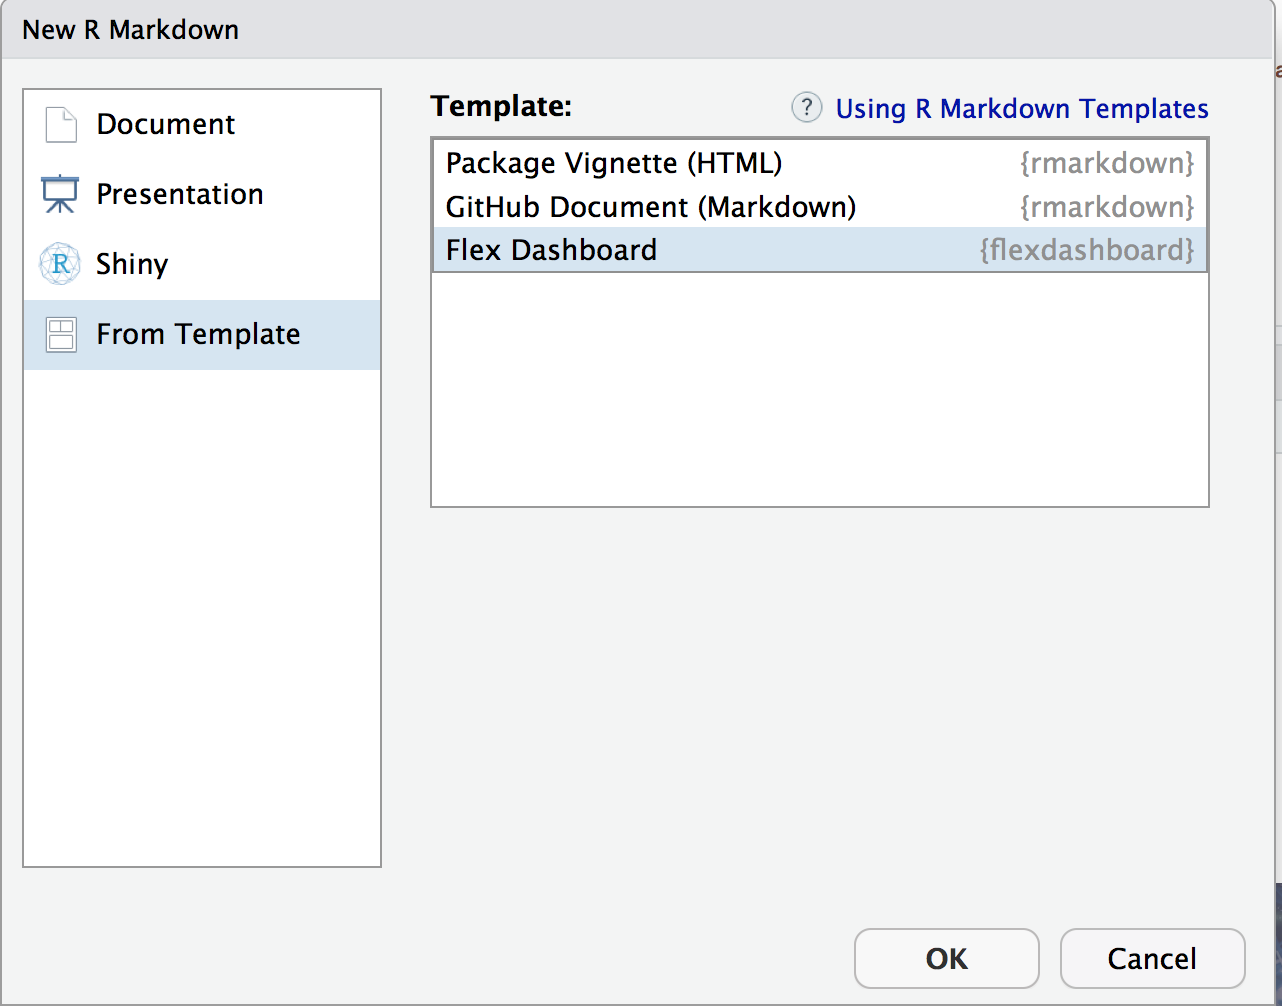
require(flexdashboard)## Loading required package: flexdashboardIn order to build a Flexdashboard, you need start a new R Markdown document, and choose From Template.
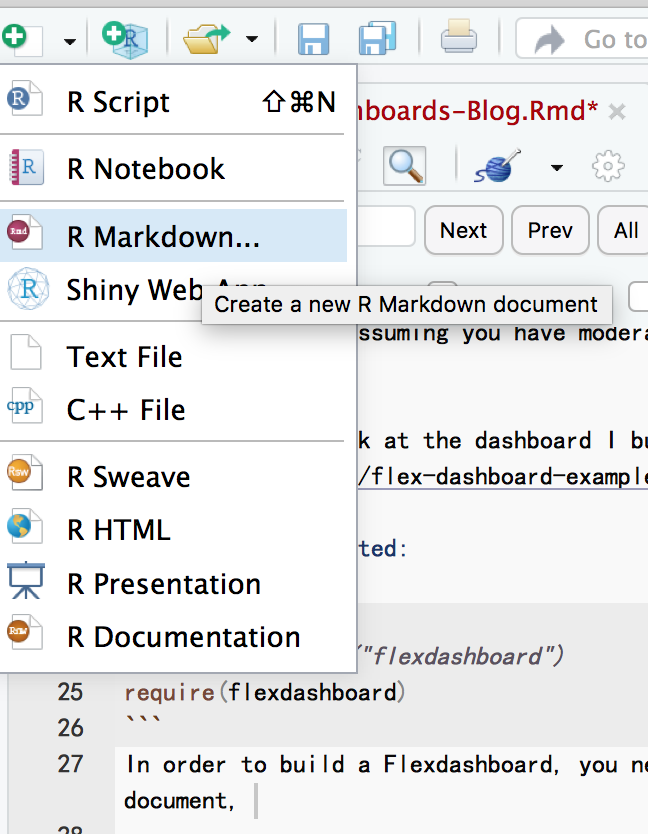
Once you’ve done that, choose flexdashboard.
The resulting document will be a flexdashboard template. Within the header of the file, you can include all of the startup code, ie. loading packages, loading flatfiles etc…
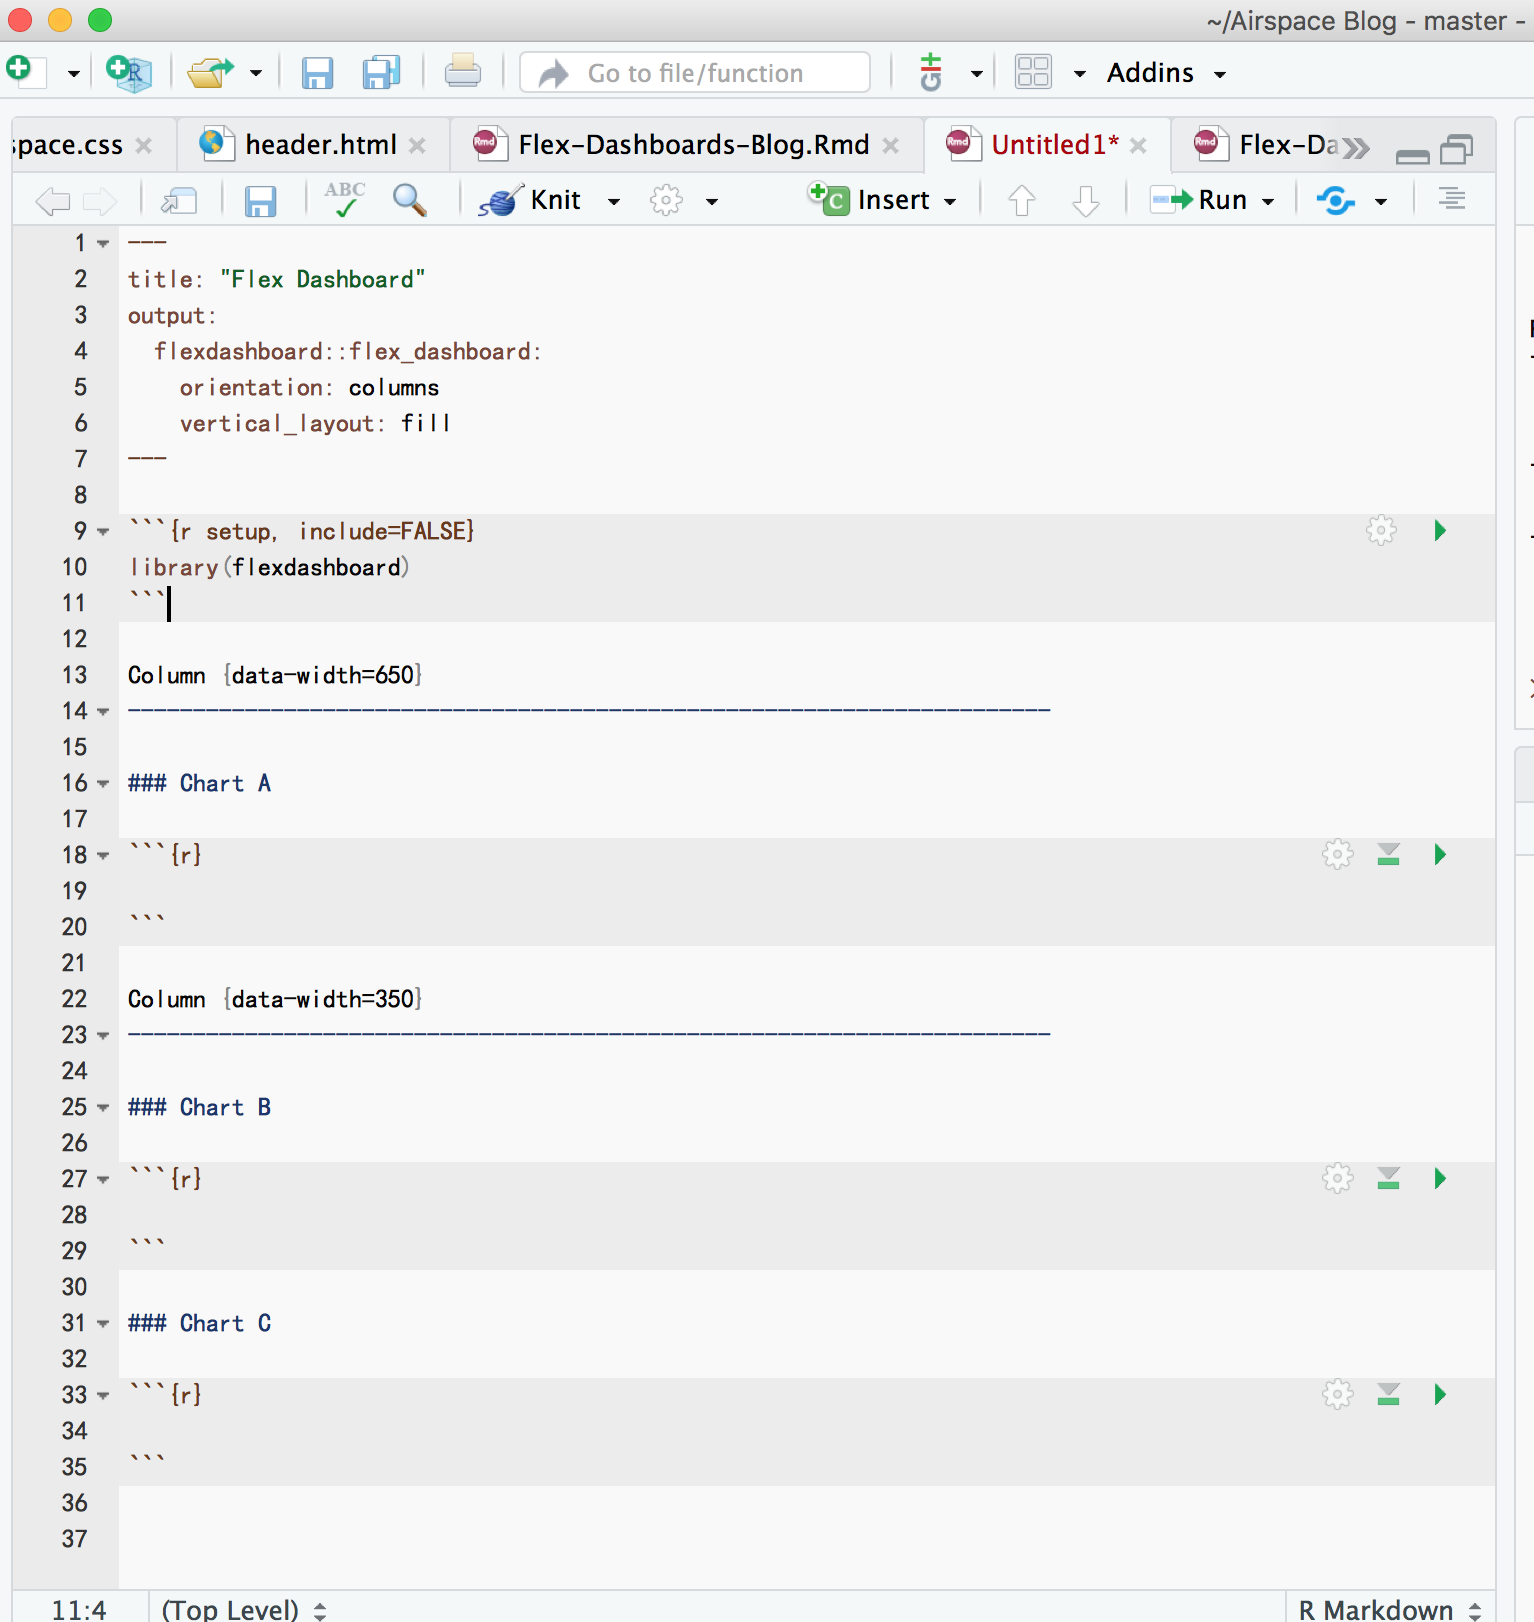
Once you have the template, you can start adding interactive plots via plotly and leaflet! It’s fairly simple to get started, and makes your blog look a lot more professional!
Some sample code added here is from an alternative fuel dataset.
Chargers$Latitude <- Chargers$Latitude %>% as.character() %>% as.numeric()
Chargers$Longitude <- Chargers$Longitude %>% as.character() %>% as.numeric() #Convert to numeric

viewLon <- mean(Chargers$Longitude, na.rm = T)
viewLat <- mean(Chargers$Latitude, na.rm = T) #Get Avg Lon & Lat for View

factpal <- colorFactor(topo.colors(5), Chargers$Fuel.Type.Code) #Create color palette

leaflet(Chargers) %>%
  addCircleMarkers(lng = ~Longitude, lat = ~Latitude, radius = 1, stroke = F,color = ~factpal(Fuel.Type.Code) )%>%
                     addTiles() %>% setView(lng = viewLon, lat = viewLat, zoom = 4) %>%
  addLegend(pal = factpal, values = ~Fuel.Type.Code, opacity = 1) #Plot to put into first r block
The following plot is a flexdashboard of Alternative Fuels Stations in the United States.